Advanced Excel and Power BI Course in MumbaiJustAcademy offers practical Advanced Excel and Power BI Training in Mumbai for students fresh graduates job seekers and working professionals who want to develop skills in data analysis business reporting and data visualisation This course combines advanced spreadsheet techniques with modern business intelligence
Advanced Excel and Power BI Course in Mumbai
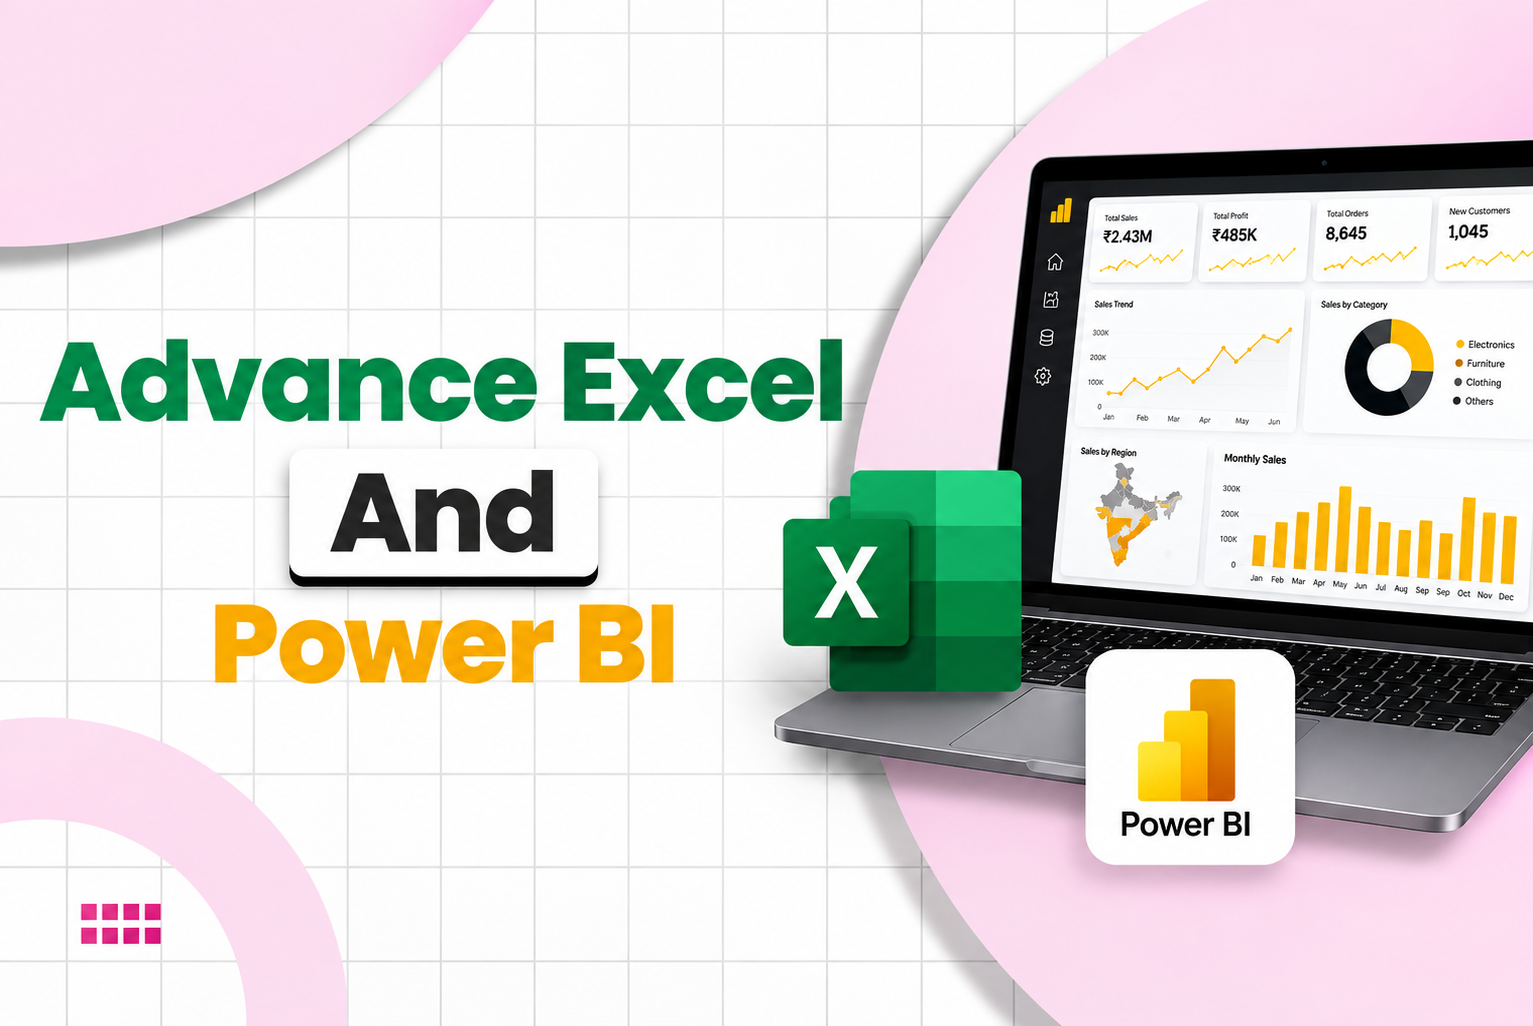
JustAcademy offers practical Advanced Excel and Power BI Training in Mumbai for students, fresh graduates, job seekers and working professionals who want to develop skills in data analysis, business reporting and data visualisation. This course combines advanced spreadsheet techniques with modern business intelligence tools to help learners work with business datasets and create meaningful reports.
Organisations across industries use Microsoft Excel and Power BI to manage information, analyse performance, prepare management reports and support business decisions. Learning both tools helps learners understand how raw data can be organised, transformed, analysed and presented through interactive dashboards.
The training covers advanced Excel formulas, lookup functions, Pivot Tables, calculated fields, data cleaning, MIS reporting, Power BI Desktop, Power Query, data modelling, DAX and dashboard development.
JustAcademy provides classroom training in Borivali East, Mumbai, with instructor-led practical sessions, hands-on exercises and project guidance. Learners also receive resume and interview preparation support along with placement assistance.
Why Learn Advanced Excel and Power BI in Mumbai?
Advanced Excel and Power BI are valuable tools for professionals involved in reporting, operations, finance, sales, HR and business analysis.
Excel helps users organise datasets, perform calculations, analyse information and prepare structured reports. Power BI helps transform data into interactive visual reports that make business performance easier to understand.
Learning both tools together can help you:
Work with large business datasets.
Perform data cleaning and data analysis.
Use advanced formulas and functions.
Create Pivot Tables and summary reports.
Develop Excel dashboards and MIS reports.
Connect and transform data using Power Query.
Create relationships between multiple datasets.
Write DAX calculations and measures.
Build interactive Power BI dashboards.
Present business insights through visual reports.
The course is suitable for beginners as well as professionals who already use basic Excel and want to improve their analytical and reporting skills.
Advanced Excel and Power BI Course Curriculum
The training combines spreadsheet analysis and business intelligence concepts through practical exercises.
Advanced Excel Modules
Module
Topics Covered
Excel Fundamentals
Workbook management, worksheets, formatting and data organisation
Advanced Formulas
IF, IFS, SUMIF, SUMIFS, COUNTIF and COUNTIFS
Lookup Functions
VLOOKUP, HLOOKUP, XLOOKUP and INDEX-MATCH
Text and Date Functions
LEFT, RIGHT, MID, LEN, TRIM and date calculations
Data Cleaning
Removing duplicates, handling errors and correcting data
Data Validation
Dropdown lists, input restrictions and validation rules
Pivot Tables
Summarising datasets, grouping and calculated fields
Pivot Charts
Visualising summarised data
Conditional Formatting
Highlighting trends, exceptions and key values
Excel Dashboards
Charts, KPIs, slicers and dashboard layouts
MIS Reporting
Sales, finance, HR and operational reporting
Microsoft Power BI Modules
Module
Topics Covered
Power BI Introduction
Power BI Desktop, interface and reporting workflow
Data Connectivity
Importing Excel, CSV and supported data sources
Power Query
Data cleaning, transformation, merging and appending
Data Modelling
Relationships, fact tables and dimension tables
DAX Fundamentals
Measures, calculated columns and expressions
DAX Functions
SUM, COUNT, CALCULATE, FILTER and related functions
Data Visualisation
Charts, cards, tables, matrices and KPI visuals
Interactive Reports
Slicers, filters, drill-down and drill-through
Dashboard Development
Report layouts, formatting and business dashboards
Publishing
Introduction to Power BI Service and report sharing
Tools Covered in Advanced Excel and Power BI Training
Learners work with commonly used tools and features for spreadsheet analysis, data preparation and business intelligence.
Tool
Purpose
Practical Application
Microsoft Excel
Spreadsheet analysis
Formulas, calculations and reporting
Pivot Tables
Data summarisation
Sales and employee reports
Excel Charts
Data visualisation
Trend and performance analysis
Power Query
Data transformation
Cleaning and combining datasets
Power BI Desktop
Business intelligence
Interactive report development
DAX
Data calculations
Measures, KPIs and business metrics
Power BI Service
Report sharing
Publishing and sharing reports
CSV and Excel Files
Data sources
Importing and preparing datasets
The focus is on understanding how these tools work together in practical reporting scenarios.
Practical Projects in Advanced Excel and Power BI
Practical projects help learners apply concepts to business situations instead of learning only through theoretical explanations. The following are suitable project scenarios for the course.
Project 1: Advanced Excel Sales Dashboard
Objective: Analyse sales performance using Excel.
Activities include:
Clean and organise sales transaction data.
Apply SUMIFS, COUNTIFS and lookup functions.
Create Pivot Tables and calculated fields.
Analyse product-wise and region-wise sales.
Develop charts and KPI summaries.
Build an interactive Excel dashboard.
Skills developed: Excel formulas, Pivot Tables, data cleaning, charts and business reporting.
Project 2: Employee MIS Reporting
Objective: Prepare employee and HR reports.
Activities include:
Organise employee information.
Calculate department-wise employee counts.
Analyse attendance and employee records.
Use conditional formatting.
Create Pivot Tables and summary reports.
Prepare an HR MIS dashboard.
Skills developed: Excel functions, data organisation, Pivot Tables and MIS reporting.
Project 3: Power BI Sales Performance Dashboard
Objective: Create an interactive sales dashboard.
Activities include:
Import sales datasets into Power BI.
Clean data using Power Query.
Create relationships between tables.
Develop DAX measures for revenue and sales.
Build product-wise and region-wise reports.
Add slicers and interactive visuals.
Skills developed: Power Query, data modelling, DAX and Power BI visualisation.
Project 4: Financial Analysis Dashboard
Objective: Analyse financial performance.
Activities include:
Organise revenue and expense datasets.
Calculate monthly totals.
Compare financial performance across periods.
Develop KPI cards and charts.
Create a financial summary dashboard.
Skills developed: Data analysis, Excel calculations, DAX and financial reporting.
Project 5: Customer Analytics Dashboard
Objective: Understand customer and transaction behaviour.
Activities include:
Organise customer and transaction datasets.
Analyse customer purchase patterns.
Calculate transaction counts and revenue.
Create customer category reports.
Develop interactive Power BI visuals.
Skills developed: Data preparation, business metrics, dashboard creation and data interpretation.
Career Opportunities After Advanced Excel and Power BI Training
Advanced Excel and Power BI skills can support career opportunities in data analysis, business reporting, finance, operations and business intelligence.
Job Role
Key Responsibilities
Relevant Skills
MIS Executive
Prepare regular management reports
Advanced Excel, Pivot Tables
Reporting Analyst
Generate business performance reports
Excel, Power BI
Data Analyst
Analyse datasets and identify trends
Excel, Power BI, data analysis
Power BI Developer
Develop interactive dashboards
Power BI, DAX, Power Query
Business Analyst
Analyse business requirements and reports
Excel, Power BI, analytical skills
Operations Analyst
Monitor operational performance
Excel, dashboards and reporting
Financial Reporting Executive
Prepare financial summaries and reports
Excel, formulas and reporting
Junior BI Analyst
Support business intelligence reporting
Power BI, data modelling and DAX
The exact job responsibilities and technical requirements vary across companies and industries.
Expected Salary After Advanced Excel and Power BI Training in Mumbai
Salary depends on practical skills, experience, company requirements, interview performance and the complexity of the role. The following table provides broad indicative annual salary ranges for planning purposes, not verified JustAcademy placement statistics or guaranteed salary outcomes.
Job Role
Indicative Annual Salary
MIS Executive
₹1.8–3.5 LPA
Reporting Analyst
₹2.5–4.5 LPA
Junior Data Analyst
₹2.5–4.5 LPA
Data Analyst
₹3–6 LPA
Power BI Developer
₹3–7 LPA
Business Analyst
₹3–6 LPA
Operations Analyst
₹2.5–5 LPA
Junior BI Analyst
₹3–6 LPA
Freshers generally begin with entry-level responsibilities, while professionals with relevant experience, strong project portfolios and additional technical skills may qualify for more advanced opportunities.
Who Can Join This Course?
The Advanced Excel and Power BI course is suitable for:
College students and fresh graduates.
Job seekers preparing for analytics-related roles.
Working professionals upgrading their reporting skills.
MIS executives interested in dashboard development.
Finance and accounting professionals.
HR and administration professionals.
Sales and marketing professionals.
Operations executives.
Beginners interested in business intelligence.
Professionals moving towards data analytics.
No advanced programming knowledge is required to start learning Excel and Power BI. Basic computer knowledge and an interest in working with data are helpful.
Advanced Excel and Power BI Training with Placement Assistance in Mumbai
JustAcademy supports learners with technical training and career preparation. Along with practical exercises and project guidance, learners can receive assistance with preparing for relevant job opportunities.
Placement assistance may include:
Resume preparation guidance.
Project and portfolio guidance.
Interview preparation.
Technical interview practice.
Guidance on relevant job openings.
Referrals and company connections where available.
Placement assistance is intended to help learners prepare for opportunities. Actual selection depends on individual performance, skills and employer requirements.
Classroom Training at Borivali East, Mumbai
JustAcademy offers classroom-based Advanced Excel and Power BI training in Borivali East, Mumbai. Sessions focus on instructor explanations, practical demonstrations, hands-on exercises and project work.
Learners practise Excel formulas, Pivot Tables, data cleaning, Power Query, DAX and dashboard development using practical datasets.
Live instructor-led sessions are also available through Google Meet or Zoom. The trainer explains concepts and shares their screen, while learners can practise activities and clarify doubts during the session.
Why Choose JustAcademy?
Feature
Learning Benefit
Instructor-Led Training
Learn concepts through trainer explanations and demonstrations
Practical Exercises
Apply Excel and Power BI concepts to datasets
Industry-Oriented Tools
Develop skills in Excel, Power Query, DAX and Power BI
Project Guidance
Practise business reporting and dashboard scenarios
Classroom Learning
Attend sessions at Borivali East, Mumbai
Live Sessions
Participate in trainer-led remote sessions
Career Support
Receive resume and interview preparation guidance
Placement Assistance
Get support with relevant job opportunities
Explore Related Courses at JustAcademy
Learners who want to expand their knowledge can explore other related training programs.
1. Power BI and SQL Training in Mumbai
Learn database querying with SQL alongside Power BI reporting, data modelling and dashboard development. This course is suitable for learners who want to combine database skills with business intelligence.
For learners looking for broader data analytics training, the bootcamp provides a wider learning pathway covering multiple analytics tools and practical projects.
If you want to focus specifically on spreadsheet analysis, advanced formulas, Pivot Tables, Excel dashboards and MIS reporting, explore the dedicated Advanced Excel program.
Enrol for Advanced Excel and Power BI Training in Mumbai
Build practical skills in spreadsheet analysis, data visualisation and business intelligence with JustAcademy's Advanced Excel and Power BI Training Course in Mumbai.
Learn to organise business data, perform calculations, prepare reports and develop interactive dashboards using industry-relevant tools.
Whether you are a student, fresher or working professional, this course can help you develop a foundation in business reporting and data analytics.
Contact JustAcademy to enquire about current batch schedules, course fees, classroom training and placement assistance.
Enroll Now Pay Later
Curriculum
Curriculum will get updated soon.
Talk to Our Advisors
Not sure about which course to choose? Our advisors are here to help you!
What Makes JustAcademy Institute of Skills Training So Special?
Learn Advanced Excel and Power BI together through practical, instructor-led training at JustAcademy in Borivali East, Mumbai. Develop skills in advanced Excel formulas, Pivot Tables, data cleaning, MIS reporting, Power Query, DAX, data modelling and interactive dashboard creation. Includes hands-on business reporting exercises, project guidance and placement assistance.